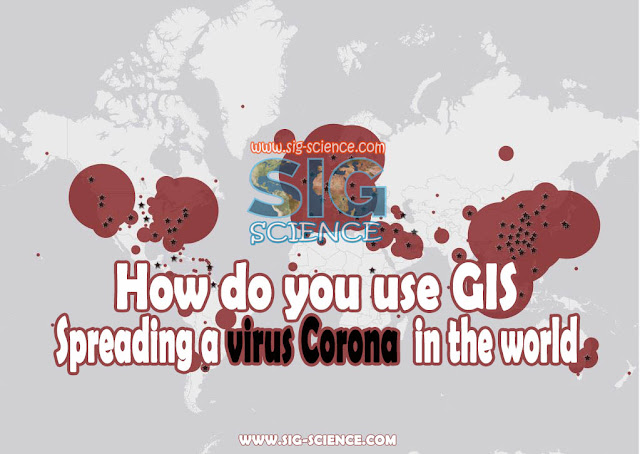
Interactive map of the spread of corona virus in the world
This animated map includes constantly updated information on virus statistics
(infections - Deaths - Recovered)
***
how do you use GIS ?
how do you use GIS ?
The role of geographic information systems is an important role in clarifying the location of the virus by using maps that are renewed every specific time (for example, an hour).
In this interactive map, which I made, based on the statistics issued by the World Health Organization (WHO), which gives us numbers about the virus around the world, we have also adopted the Arcgis program for drawing to represent these data and publish them on the Esri platform.
The representation here is limited in the countries because it is difficult to limit the virus to a specific location, so the data released reflect the virus within the geographical limits of each country.
Also to predict the spread of the virus or any other virus using geographical information systems based on accurate and accurate data And restrict the affected geographical area to infer the places that can be reached and protected.
In the absence of geographic information systems, especially dynamic maps, it may become more difficult to benefit from these new data, as it is not possible to determine the places that will witness new infections and know the nature of the spread of the virus.
In these cases, we are racing against time to discover the places where the virus appeared, in order to examine people who were in a relationship with that location, and this geographic information systems can benefit us greatly with a buffer.
In the meantime I am writing this article for the 3/16/2020 - 00:10
In conclusion, I say that geographic information systems have a great role in analyzing and tracking the spread of the Corona virus, as it gives and guides officials to take appropriate and responsible decisions in restricting this Corona virus.
In the meantime I am writing this article for the 3/16/2020 - 00:10
Coronavirus Injuries:182,403 - Deaths:7,144 - Recovered:78,342
Interactive map to track the virus in the world
Information about the virus
Source information (*www.cdc.gov/COVID19)
Source information (*www.cdc.gov/COVID19)
Coronavirus disease 2019 (COVID-19) is a respiratory illness that can spread from person to person. The virus that causes COVID-19 is a novel coronavirus that was first identified during an investigation into an outbreak in Wuhan, China.
Coronaviruses are a group of related viruses that cause diseases in mammals and birds. In humans, coronaviruses cause respiratory tract infections that can be mild, such as some cases of the common cold (among other possible causes, predominantly rhinoviruses), and others that can be lethal, such as SARS, MERS, and COVID-19. Symptoms in other species vary: in chickens, they cause an upper respiratory tract disease, while in cows and pigs they cause diarrhea. There are yet to be vaccines or antiviral drugs to prevent or treat human coronavirus infections.
Coronaviruses constitute the subfamily Orthocoronavirinae, in the family Coronaviridae, order Nidovirales, and realm Riboviria. They are enveloped viruses with a positive-sense single-stranded RNA genome and a nucleocapsid of helical symmetry. The genome size of coronaviruses ranges from approximately 27 to 34 kilobases, the largest among known RNA viruses. The name coronavirus is derived from the Latin corona, meaning "crown" or "halo", which refers to the characteristic appearance reminiscent of a crown or a solar corona around the virions (virus particles) when viewed under two-dimensional transmission electron microscopy, due to the surface covering in club-shaped protein spikes.
Stay in your home


